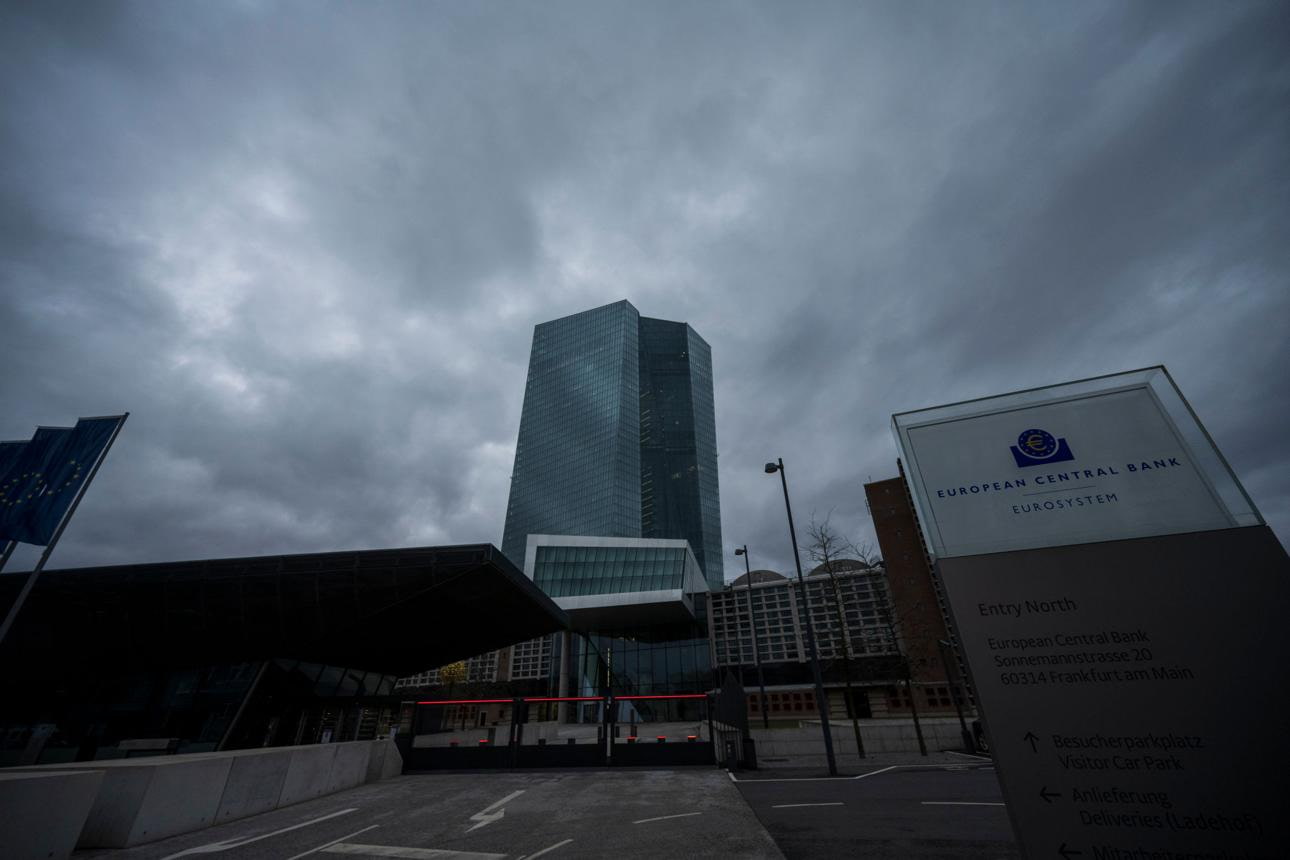

Tartu: Economists at Estonian universities now open a browser tab instead of a spreadsheet when they want the state of the European economy. Eurostat published the August edition of its statistical monitor on 20 August, a monthly dashboard that puts economy, environment, business, health and labour indicators for the Union, its Member States and the EFTA countries on a single screen.
The August commentary reads more mixed than the headline suggests. Gross domestic product continued to expand, at a slightly faster pace than during 2025. Industrial production and production in services both grew. Economic sentiment improved across every sector except construction, a familiar exception in a period of elevated financing costs and cooling residential demand. Retail trade declined slightly, which sits awkwardly beside improving sentiment and suggests households feel better than they spend.
The fiscal line carries the sharper signal. Government deficit and debt both increased as a share of gross domestic product at Union level. Deficits normally narrow when growth accelerates, because tax receipts rise and automatic stabilisers relax. Rising deficits alongside faster growth point at discretionary spending, most plausibly defence and energy commitments, and that combination matters for the fiscal rules that returned to force after the 2024 governance reform. Member States on adjustment paths have committed to net expenditure ceilings, and a dashboard showing debt ratios drifting upward will shape the autumn budget assessments.
Environmental indicators complicate the decarbonisation story. Greenhouse gas emissions per capita rose marginally quarter on quarter, even as the share of electricity generated from renewable sources increased and monthly electricity consumption fell along its usual seasonal path. Coal reached a record low share of Union electricity production during the same period, according to a separate Eurostat release on 13 August. Cleaner power that coexists with rising per capita emissions points at transport, heating and industrial process emissions, the sectors that resist substitution.
Air quality moved the right way, with concentrations of pollutants in European capitals decreasing. That measure responds to local policy, low emission zones and fleet turnover more than to Union climate legislation, and it is one of the few indicators on the dashboard where a mayor can claim direct credit.
The format itself represents a choice by Eurostat. Statistical offices traditionally publish releases and let others assemble the picture. A curated dashboard with an official commentary moves the agency closer to interpretation, which raises questions about the boundary between statistics and analysis. Eurostat has kept the commentary descriptive, avoiding causal claims, but selecting which indicators appear on one screen is already an editorial act.
Users get a practical benefit that outweighs the concern. National statistical institutes publish on different calendars and with different revision policies, and comparing Portugal to Poland on a Tuesday afternoon previously meant reconciling three vintages of data. The monitor updates monthly with the latest available figure for each indicator, which makes the comparison defensible even when it is not perfectly synchronised.
The dashboard also lands in a year when the Union’s statistical capacity faces new demands. Fiscal surveillance, climate reporting and defence spending commitments all require comparable national figures delivered quickly. Whether a monthly dashboard sharpens that debate or simply summarises it will be clear by the time the September edition appears.